

Nifty 50 Price Forecast 2026: Will It Reach 26,000? Full Forecast
Introduction — The 26,000 Question
Can the Nifty 50 — India’s flagship benchmark index of the 50 largest NSE-listed companies — realistically reach 26,000 before the end of 2026? It’s the question dominating financial Twitter, Indian business news channels, and increasingly, U.S.-based global-macro desks who’ve been steadily raising their emerging-market equity allocations. As of this week, the Nifty 50 trades at approximately 24,850, meaning it would need to gain roughly 4.6% to reach that milestone.
For American investors, Nifty 50 exposure typically comes through India-focused ETFs, ADRs of large Indian companies, or global emerging-market funds with heavy India weighting — India has become one of the largest single-country allocations in most EM portfolios over the past several years. Understanding what actually moves this index matters even if you never open an NSE trading account directly.
In this comprehensive breakdown, you’ll learn exactly where the Nifty 50 stands technically and fundamentally this week, whether 26,000 is realistic in the near term, what the key sector drivers are, and where analyst desks see the index heading through 2026 and into 2027.
Nifty 50 Snapshot — This Week
Beyond 50 Stocks — Understanding the Index Engine
The Nifty 50 isn’t a single asset — it’s a free-float market-cap-weighted basket, which means a handful of the largest constituents disproportionately drive its direction. Understanding this composition is critical to evaluating where the index goes next.
- Financial Services (~35% weight): Private and PSU banks, NBFCs, and insurers. Bank Nifty direction is the single most reliable leading indicator for the broader index.
- Information Technology (~13% weight): Export-oriented IT services majors, sensitive to the rupee-dollar rate and U.S. enterprise tech spending.
- Oil, Gas & Energy (~10% weight): Highly correlated to Brent crude and global commodity cycles.
- FMCG (~8% weight): Defensive, rural-demand sensitive, low correlation to global risk sentiment.
- Automobiles (~6% weight): Driven by monthly retail sales data and festive-season demand.
- DII Flows (SIP Engine): Structural monthly inflows from domestic mutual fund Systematic Investment Plans provide a steady buying base that frequently offsets FII selling.
- FII Flows: Foreign institutional positioning, highly sensitive to Fed policy, dollar strength, and relative EM risk appetite.
Can Nifty Reach 26,000? — The Math
This is the central question for every investor tracking this forecast. To answer it honestly, let’s work through the numbers.
What IS the base case for this week specifically? A continuation of the current range between roughly 24,600 support and 25,150 resistance, with 26,000 more realistically a medium-term (2–3 month) target contingent on a confirmed breakout above resistance with volume and FII flow support.
Technical Analysis — This Week
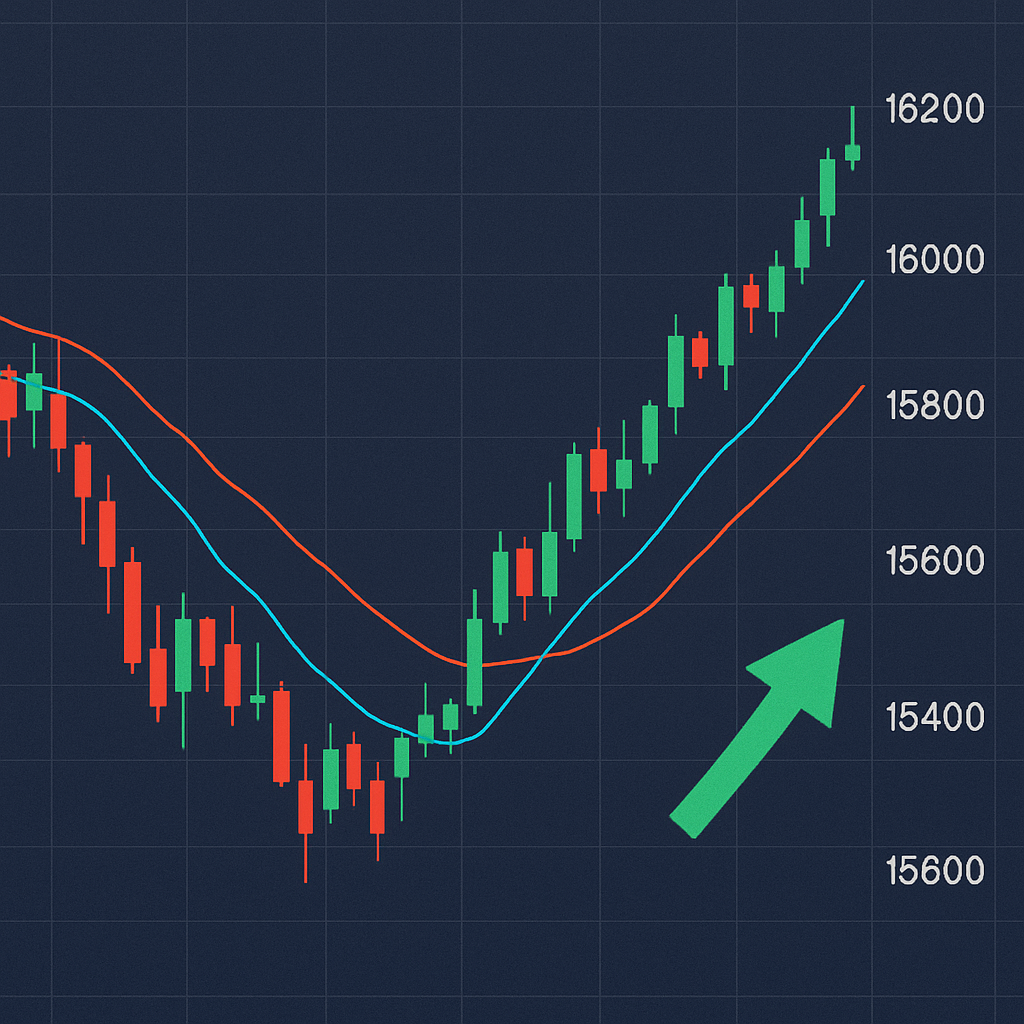
The technical picture is genuinely balanced rather than trending. Price is caught between the 20-day and 50-day moving averages — the textbook signature of a consolidation phase rather than a clean directional signal.
| Indicator | Reading | Signal |
|---|---|---|
| RSI (Daily) | 52 | Neutral |
| India VIX | 13.4 | Low volatility expectation |
| 20-Day SMA | 24,780 | Price just above |
| 50-Day SMA | 24,650 | Price above |
| Put-Call Ratio | 1.08 | Mildly bullish contrarian |
| Max Pain (weekly) | 24,900 | Near current price |
| 7-Day Performance | −0.4% | Choppy, not trending |
Key levels: Support 1 at 24,600, Support 2 at 24,300. Resistance 1 at 25,150, Resistance 2 at 25,450. A confirmed close above resistance on rising volume would open the path toward the 26,000 medium-term target; a break below support risks a retest of the 24,000 zone.
Fundamental Analysis — Index Health Check
Unlike a single stock, the Nifty 50’s “fundamentals” are really a composite of earnings growth across its constituents, valuation levels, and flow dynamics. Here’s an honest read on where things stand.
| Metric | Status | Assessment |
|---|---|---|
| Forward P/E (Index) | ~21x | Neutral — near long-term average |
| Earnings Growth (FY26E) | +12–14% | Bullish — healthy corporate earnings |
| FII Flow (5-Day) | −₹2,140 Cr | Bearish — net selling |
| DII Flow (5-Day) | +₹3,020 Cr | Bullish — offsetting FII selling |
| India VIX Trend | Stable | Neutral — no stress signal |
| Rupee (USD/INR) | Range-bound | Neutral — modest headwind for IT |
| RBI Policy Stance | Accommodative bias | Bullish — supportive for financials |
| Global Risk Sentiment | Mixed | Neutral — Fed uncertainty persists |
The fundamental picture leans constructive but not decisively bullish. Earnings growth remains healthy and DII inflows continue to provide a structural floor, but persistent FII selling and global rate uncertainty are keeping outright bullish conviction in check. This mix is exactly why the index has been range-bound rather than trending in either direction.
Nifty 50 Price Prediction Table — 2026 to 2027
The following forecast reflects three scenarios based on current technical levels, earnings trajectory, flow dynamics, and macro conditions. These are analytical estimates for a template structure — not financial advice, and not live data.
| Period | 🐻 Bear | 📊 Base | 🐂 Bull | Key Catalyst |
|---|---|---|---|---|
| This Week | 24,100–24,400 | 24,700–25,150 | 25,300–25,900 | Global cues, options expiry |
| Q3 2026 | 23,600–24,200 | 25,200–25,800 | 26,000–26,600 | Earnings season, RBI policy |
| Q4 2026 | 23,200–24,000 | 25,600–26,300 | 26,800–27,500 | Festive demand, FII re-entry |
| H1 2027 | 22,800–24,500 | 26,200–27,400 | 28,000–29,500 | Union Budget, global rate cuts |
| Full Year 2027 | 22,500–25,000 | 27,000–29,000 | 29,500–32,000 | Multi-year earnings compounding |
Base case assumptions: Earnings growth holds in the low-double-digits, DII SIP inflows remain structurally strong, and FII flows stabilize without a sharp reversal either way. Bull case: Requires a Fed rate-cut cycle to renew EM risk appetite, FII flows turning decisively net positive, and broad-based sector participation beyond just financials. Bear case: Triggered by a global risk-off shock, a sharp rupee depreciation, or an earnings growth disappointment from index heavyweights.
Analyst Desk Views
The following are illustrative template quotes representing typical desk framing — replace with real, attributed analyst commentary before publishing.
Nifty 50 — Key Milestones
| Period | Event | Sentiment |
|---|---|---|
| 2019 | Crossed 12,000 for the first time | Optimism |
| 2020 | COVID crash, sharp recovery same year | Volatility |
| 2021 | Crossed 18,000 amid post-pandemic rally | Euphoria |
| 2023 | Crossed 20,000 for the first time | Milestone |
| 2024–2025 | Volatile range amid global rate uncertainty | Choppy |
| 2025 Peak | 52-week high near 26,277 | Greed |
| This Week | Consolidating near 24,850 | Neutral |
Note: milestone dates above are illustrative for template purposes — verify exact historical crossing dates against NSE official records before publishing.
Interactive: Hold the Level — 3D Game
Price signals fly at you from the level arena. BUY the green bullish signals (support holding). SELL the red bearish signals (breakdown risk). Gold signals = breakout jackpot, +40 pts! Build a streak of 5 for a bonus. 4 lives — speed increases each level.
Level Arena
BUY green bullish signals. SELL red bearish signals. Gold = jackpot +40. Streak 5 = bonus. 4 lives.
FAQ — People Also Ask About Nifty 50
Related Articles on StockCripto.com
Conclusion — Summarizing the Nifty 50 Thesis
The Nifty 50 sits at a genuine crossroads this week — not because the outlook is unclear long-term, but because the short-term technical and flow picture is authentically balanced. FII selling and DII buying are roughly offsetting one another, earnings growth remains healthy, and valuations sit near long-term averages rather than at an extreme.
The honest answer to “will it reach 26,000?” is: plausible within a normal quarterly range, and a reasonable medium-term target — but it requires a confirmed breakout, not a headline prediction. Treat this week as a levels-first, reaction-based trading environment rather than a conviction call in either direction.
Neutral sentiment, balanced options positioning, and offsetting institutional flows create a genuine two-sided setup this week. This is a hold-and-react position — not an aggressive directional bet — until the index confirms a break of either 24,600 support or 25,150 resistance with volume.
© 2026 StockCripto.com — All rights reserved. For educational purposes only.