

Nifty 50 Forecast This Week:
Key Levels to Watch
A level-by-level breakdown of where the Nifty 50 could find support or run into resistance this week — covering technicals, sector rotation, options data, FII/DII flows, and a full 2026 outlook for U.S. and global investors tracking Indian equities. Educational only. Not financial advice.
A levels-first week, not a conviction week
The Nifty 50 enters this week sitting at a genuine decision point rather than a comfortable midpoint of an established trend. Price action over the past several sessions has been choppy instead of directional, which typically signals that the market is waiting on a catalyst rather than committing to a clear side. That kind of environment rewards a level-based approach far more than a headline-based one — headlines move fast and often reverse within a session, while support and resistance zones tend to hold their significance for days or weeks at a time.
Over the trailing month, the index has traded in a range wide enough to frustrate both aggressive bulls and aggressive bears. Rallies have stalled just below a well-defined ceiling, while dips have found buyers a little too consistently for the bears to gain full control. That tug-of-war is the single most important thing to understand before reading any specific price target this week.
Technical structure — trend, momentum, and volume
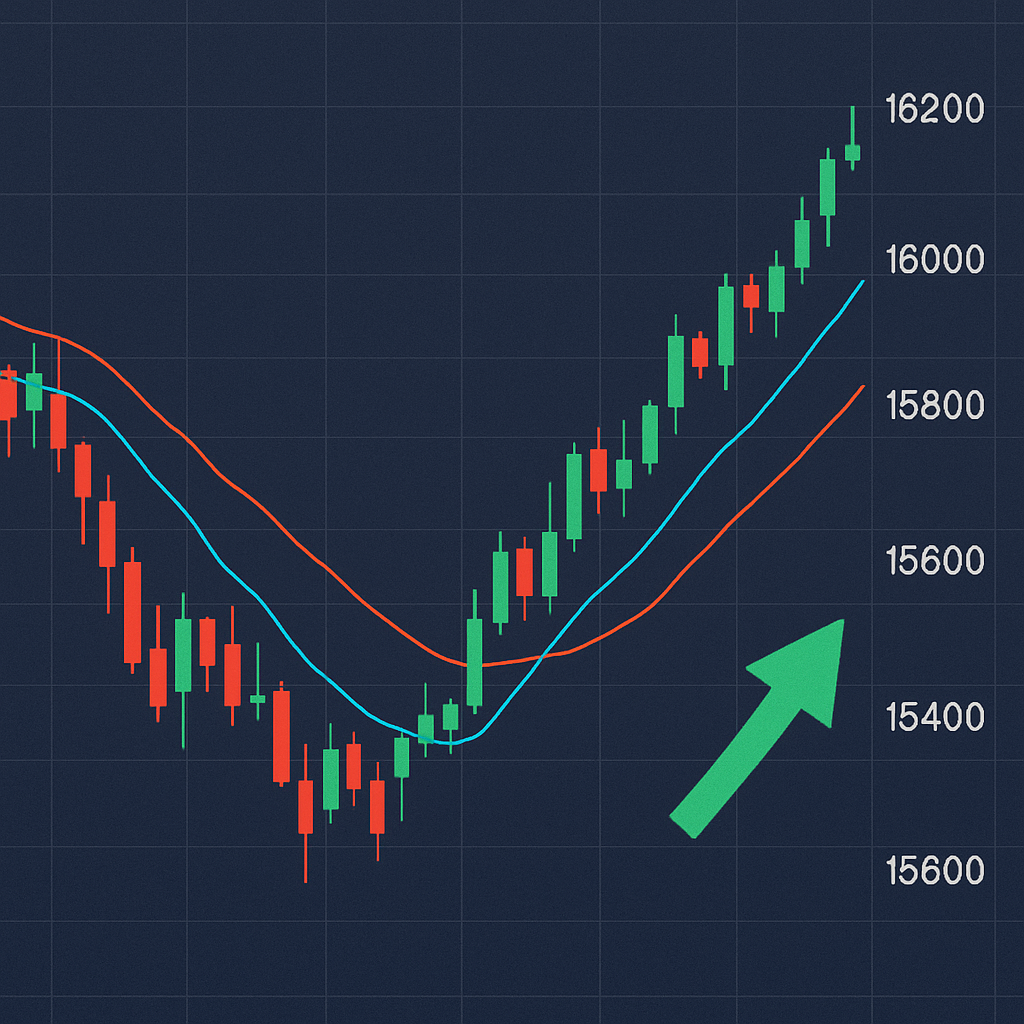
Price is currently caught between the 20-day and 50-day moving averages — the textbook signature of a consolidation phase. RSI on the daily chart sits in the neutral 45–55 band, reinforcing the “wait for a level to react to” thesis rather than a “trade the trend” thesis. A move toward resistance on declining volume is a weak signal; the same move on expanding volume, especially above the 20-day average, would be a far more credible signal that institutional participation is backing the move.
What would confirm the bullish case
A daily close above resistance on above-average volume, broader participation from banking and IT heavyweights rather than one or two stocks carrying the index, and supportive global cues (U.S. futures, crude oil, dollar index) would all strengthen the case for a break toward the bull-case target.
What would confirm the bearish case
A break and close below support — especially on a gap-down — combined with rising India VIX and FII selling that persists rather than eases through the week, would meaningfully raise the odds of a deeper corrective move toward the bear-case level.
2026 outlook: where does Nifty 50 go from here?
Zooming out from the weekly noise, the multi-month case for Indian equities rests on three pillars: resilient domestic consumption, continued DII inflows from a structurally growing SIP base, and earnings growth in financials and IT that has broadly kept pace with index valuations. The bear risk to that thesis is a sustained FII outflow cycle driven by a stronger dollar or a global risk-off shock, which DII buying alone may not be able to fully offset in a sharp selloff scenario.
| Day | Level | Bias | Catalyst |
| Mon | 24,900 | +0.2% | Global cues |
| Tue | 24,950 | +0.2% | FII/DII data |
| Wed | 24,880 | −0.3% | Options expiry watch |
| Thu | 25,050 | +0.7% | Earnings reaction |
| Fri | 25,300 | +1.0% | Weekly close |
Four scheduled events with the highest potential to move the index off its current range this week.
Financial Services carries the single largest weight — its direction typically leads the index.
| Metric | Nifty 50 (NSE) | Sensex (BSE) |
|---|---|---|
| Current Level | 24,850 | 81,420 |
| Weekly Resistance | 25,150 | 82,600 |
| Weekly Support | 24,600 | 80,300 |
| Constituents | 50 | 30 |
| Heaviest Sector | Financial Services (~35%) | Financial Services (~38%) |
| Weekly Bias | Range-bound | Range-bound |
A near-even bullish/neutral split reflects genuine two-sided positioning heading into this week — consistent with the range-bound technical structure described above.
Hold the Level! 📈
Price signals fly at you from the level arena. BUY the green bullish signals (support holding). SELL the red bearish signals (breakdown risk). 📈 Gold signals = BREAKOUT JACKPOT +40 pts! Streak 5 = LEVEL MASTER bonus! 4 lives. Speed surges each level!
📈 Level Arena
Price signals fly from the arena. BUY green bullish signals (support holding). SELL red bearish signals (breakdown). Gold signals = JACKPOT +40! Streak 5 = LEVEL MASTER! 4 lives. Level up every 100 pts!